Beta Prototype
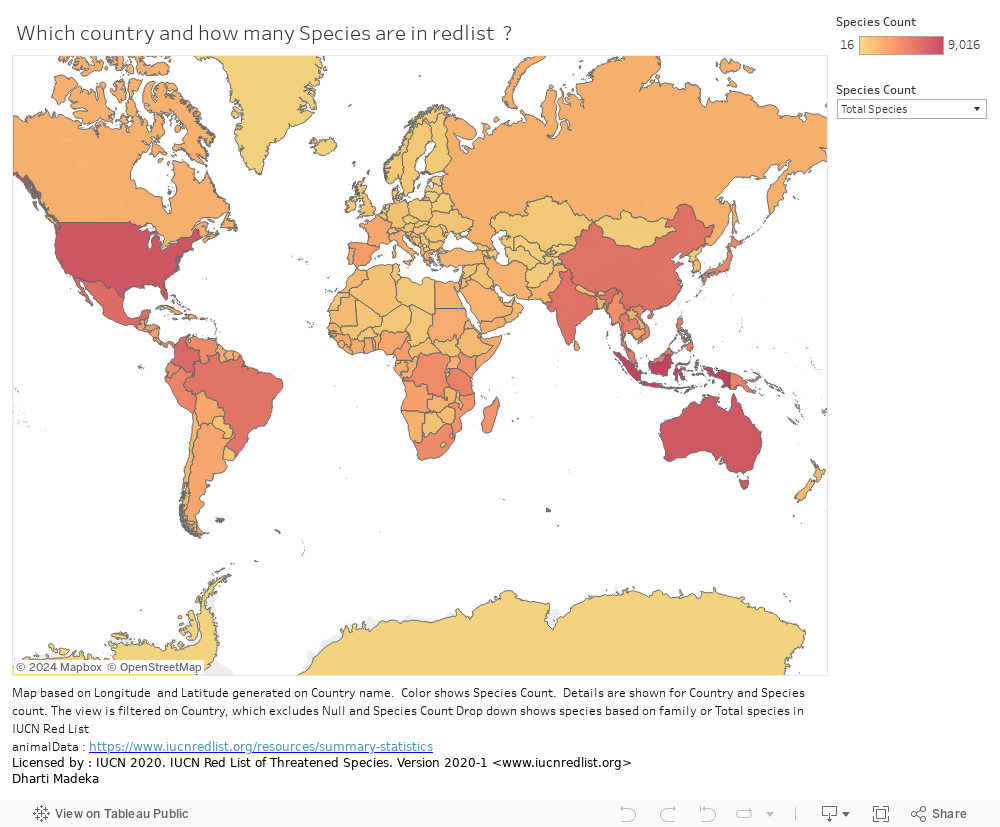
How many Species in IUCN Red List globally compared to Species in each family in IUCN Red List ?
Answer
From this Prototype, it is clearly visible that highest number of Endangered Species in IUCN Red List is in Indonesia, followed by Australia and USA. This is due to a lot of poaching for animals skin in this area to create Handbags and a lot more. While Amphibhians are more Endangered in Mexico or Columbia. Plants and Reptiles have highest number in Madagascar. Fishes have highest number in USA, due to more consumption of sea food.
Encoding
This prototype is created using Tableau. In the prototype, number of Species in Red List in each country is encoded over sequential color range. Darker the color, more number of species are in Red List in that particular country. Also all Endangered species are filtered over select controller, which select species and shows it over map. A basemap consists of countries in the world, on top of basemap IUCN Red List Endangered Species are visualized.
Planned Interactivity
Interactivity will be of filtering which will give change the color on map to show species in IUCN Red List according to respective families and Total Species count across the globe. Details on Demand, as on hover, it shows name of country and count of species in IUCN Red List in that particular country.