The Averge Response Time and Arrive Time For Emergencies 2010-2019
by Kate Luo, Mar 2, 2020
How could we know is the San Francisco Fire Department fully equipped to handle the multitude and wide range or emergencies that occur in San Francisco?
This is a common scenario in fire departments across the country. A resident has a fire or emergency medical situation and calls 9-1-1, call in take information is gathered, the tones go off, crews are dispatched, and firefighters turn out and arrive on scene to mitigate the situation. The response time and arrive time, it is the most strightforward aspect to see how fast or slow does San Francisco Fire Department to handle emergencies.
Context For This Data Visualization
-
Data ETL(Extract, Tranform and Load)
Response Time: first we need to know the definition of response time: response time is the total amount of time it takes to respond to a request for service. In this senario, the response time is calculat the different between Received DtTm(date and time of call is received at the 911 Dispatch Center) and Respond DtTm(Date and time this unit acknowledges the dispatch and records that the unit is en route to the location of the call).
Arrive Time After Respond: we use On Scene DtTm(Date and time the unit records arriving to the location of the incident) and Resond DtTm(ate and time this unit acknowledges the dispatch and records that the unit is en route to the location of the call) to find out how many time to arrive.
-
Description of visualization
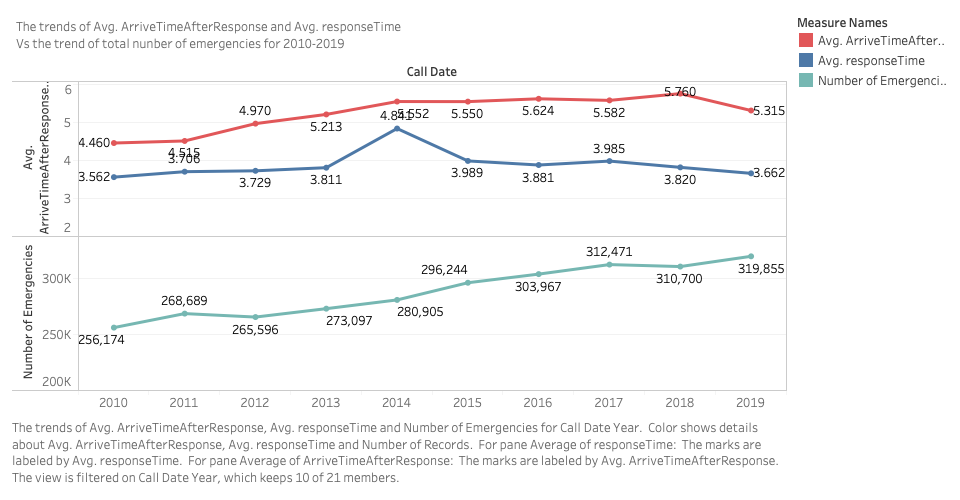
Axis info: the trends of Avg. ArriveTimeAfterResponse and Avg. responseTime for 2010-2019. Color shows details about Avg. ArriveTimeAfterResponse and Avg. responseTime.
Dimensions and Measures:
- Average of responseTime ranges from 3.562 to 4.841 on this sheet.Average of ArriveTimeAfterResponse ranges from 4.460 to 5.760 on this sheet.
- Measure Names has 2 members on this sheet. Members: Avg. ArriveTimeAfterResponse; Avg. responseTime. Call Date Year has 10 members on this sheet Members: 2012; 2013; 2014; 2015; 2018; ...
- Sum of Number of Emgerency ranges from 256,174 to 319,855 on this sheet.
-
The Standard: NFPA
How do fire departments accurately evaluate their response in respond time and arrive time?
The basic idea is that the arrival of an effective response force on scene in less than 8 minutes (performance metric in NFPA 1710).
-
Visualization Analysis
From this datalization, we could easily see that the average of respond time don't increase though the number of emgerencies increase yearly. Moreover, we could see the maximum of averge respond time is 4.841 mimutes and the maximum of arrive time is 5.760. The total effective response is pretty high.Fire department response times and force assembly times are pretty low, it is more likely sufficient resources have been deployed, which is associated with more positive outcomes from risk events.
The relationship between deployment of resources, response time and positive outcomes is circular. If fire department response times and effective response force assembly times are low, it is more likely that sufficient resources have been deployed, which is associated with more positive outcomes from risk events. Conversely, if response times and effective response force assembly times are high, it is more likely that insufficient resources have been deployed, which is associated with more negative outcomes.
The Feedback
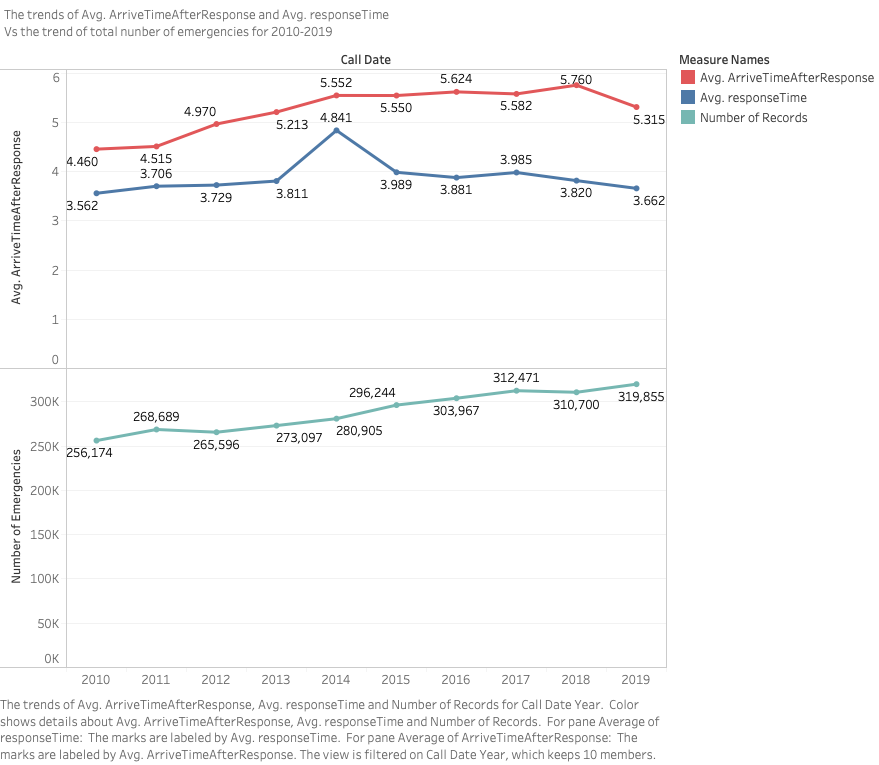
- Axis and Scale: change the axis and scale to get rid of the excessive white space in the phototype. Also, clarify the Y-axis for the top chart as time in minutes.
- Visual: add dotted line with averge respond time and arrive time to make readers more easier to compared.
- Analysis: discuss more about the visual anomaly that occurred in 2014 since the avg response time increased by more than one minute.