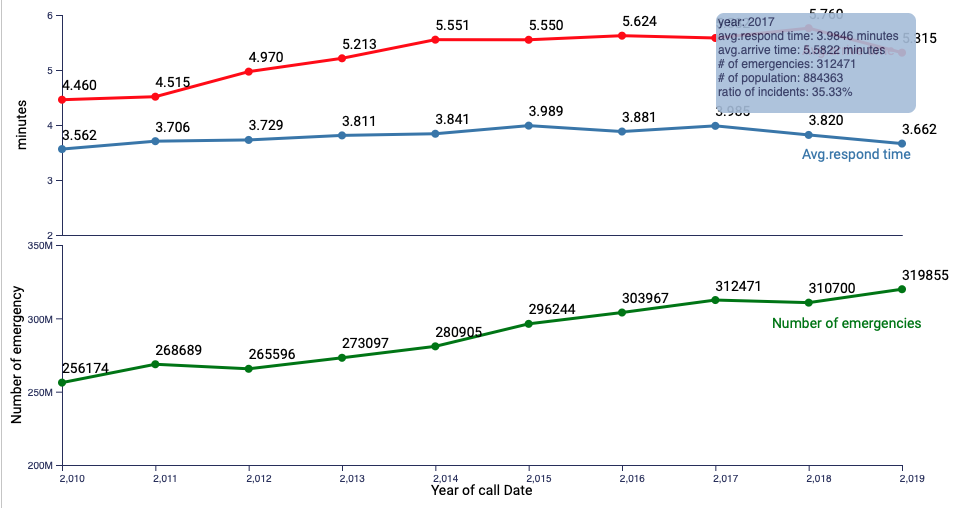
The Averge Response time and Arrive time for emergencies 2010-2019
by Kate Luo, Mar 2, 2020
Interactive struction
ToolTips(infotip)In this line chart, I create a graphical user interface element: tooltip. When you hovers over an item, without clicking t, and a tooplip which including the year of call data, the averge of respond time, the averge of arrive time and total number of emergencies will appear.
D3 implementations(ToolTips)
Interactive Instruction
Brush & ZoomIn this line chart, I create a graphical user interface element: Brush & Zoom. Converted the Brush & Zoom area chart block to work with line charts and combining d3-brush and s2-zoom to implement focus + context.
D3 implementations(Brush & Zoom)
Explore respond time VS neighborhoos
After estimate the whole San Francisco's respond time, you maybe want to know which county will have high respond time and which county have low respond time.
Clik "Learn more" to get your answer.
Learn more