- (Image Source - Best Business Intelligence and Data Visualization Tools for 2029 - February 21, 2019)
Wrangling
The dataset for the below prototype is wrangled in the following way:
Filtered By:    Incident Datetime between "March 1, 2020" and "March 31, 2020",
                Incident Category as "Assault"

Grouped By:     Incident Date (day), Incident Number, Incident Subcategory,
                Incident Description, Police District, Analysis neighborhood,
                Supervisor District

Aggregated By:  Incident Number (sum)
Tableau Prototype (Alpha Release)
Data Encoding and Interpretation
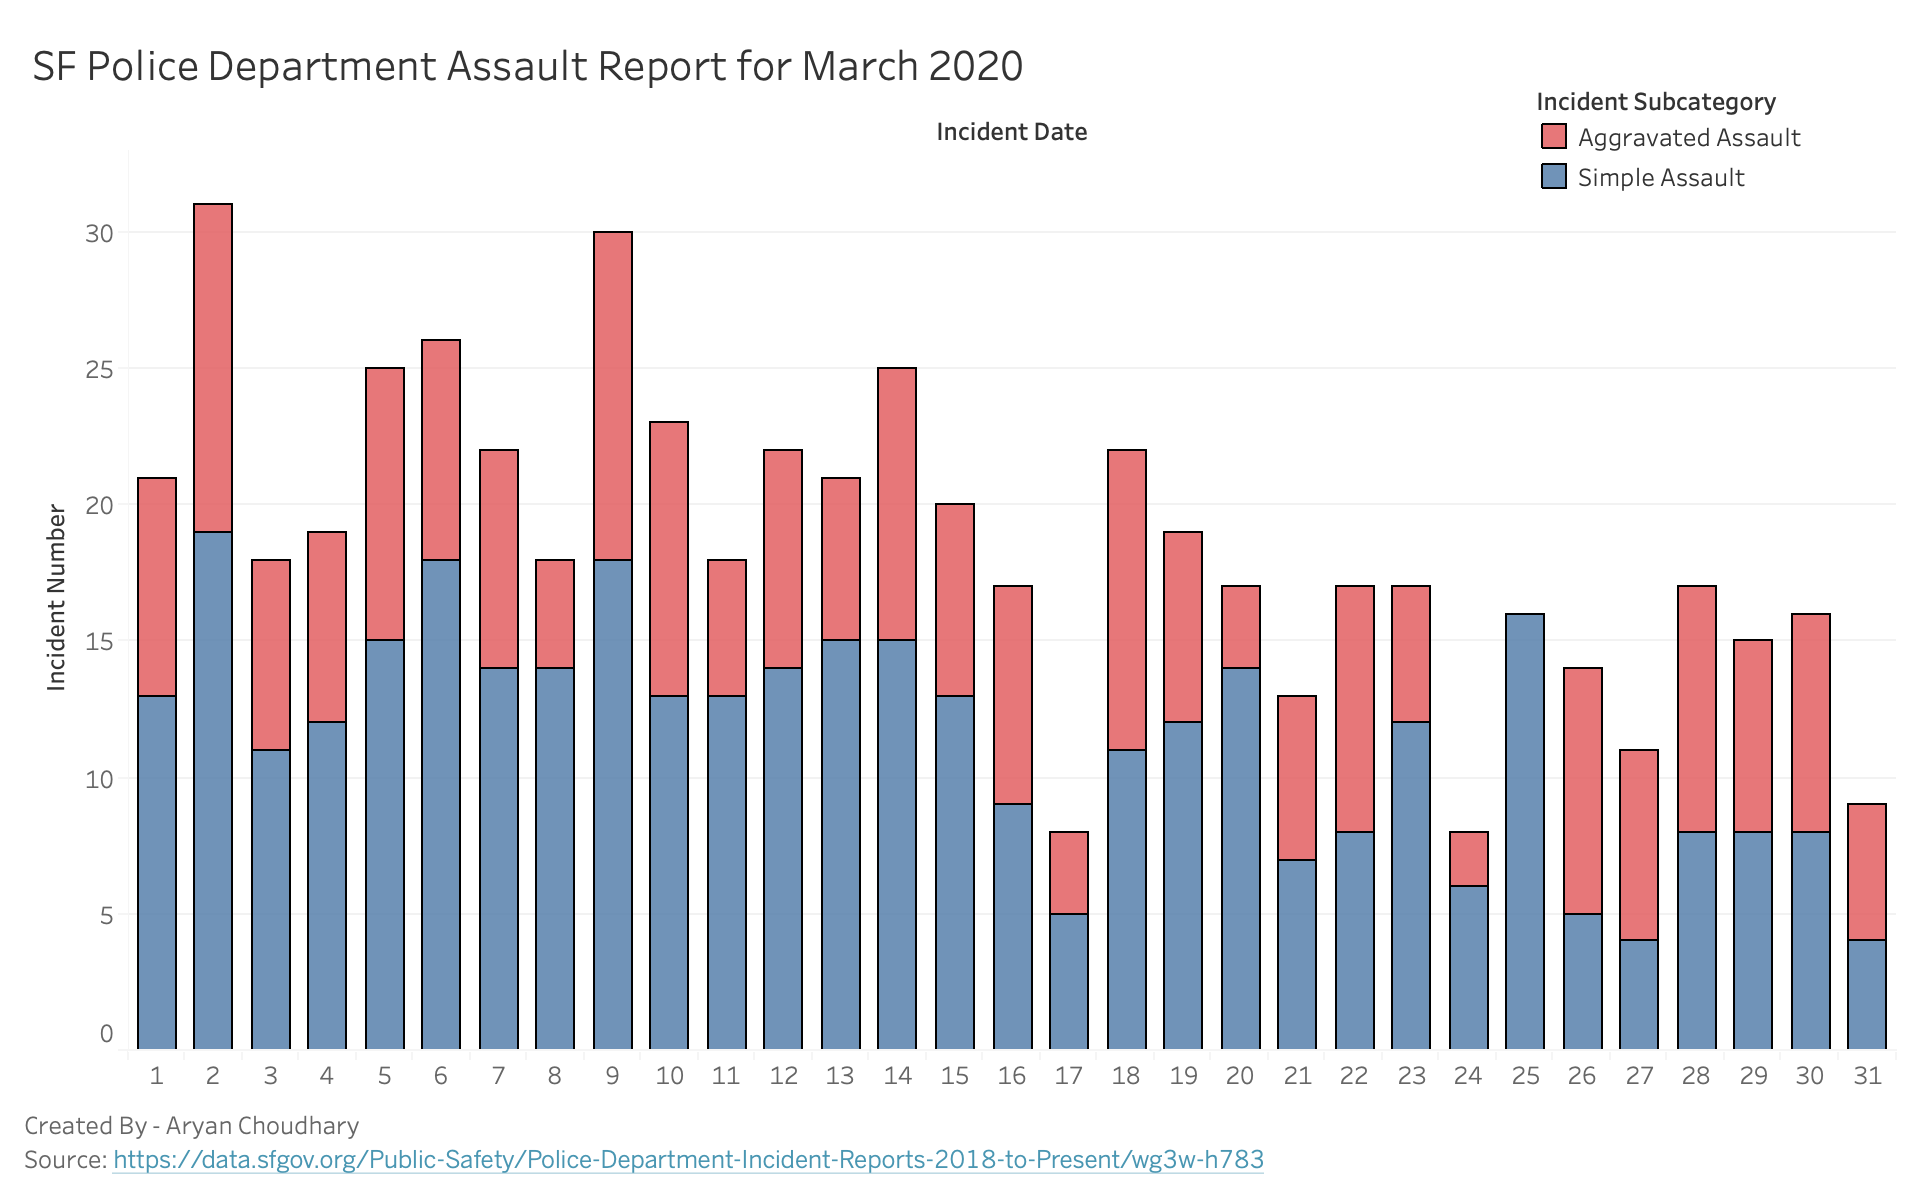
Color show the incident subcategory -
- Aggravated Assault
- Simple Assault
Conclusion based on the prototype
- March 2nd has the highest number of assault cases reported.
- There is a little decrease in assault cases after the lockdown period was started (March 17, 2020).
Peer Review Feedback
That will be an interesting look at this dataset. The dataset will have a good mix of data types for this project. I strongly recommend, since this is a dataset we have looked at before, that you try to connect directly to the data using their SODA API. You just need to create an account and then an API key (both free).