Ned
Personal Wrangling
To create this visualization, I reduced the data using Tableau after prototyping and reformatted it using a Python script that I wrote to meake the JS code more readable.
Tableau Prototype
D3 Implementation
The interactivity I plan to implement in the final version of this visualization is that when you brush over a line with a mouse, it will grey out all the other ones and bring the selected line to the top so it can be better observed.
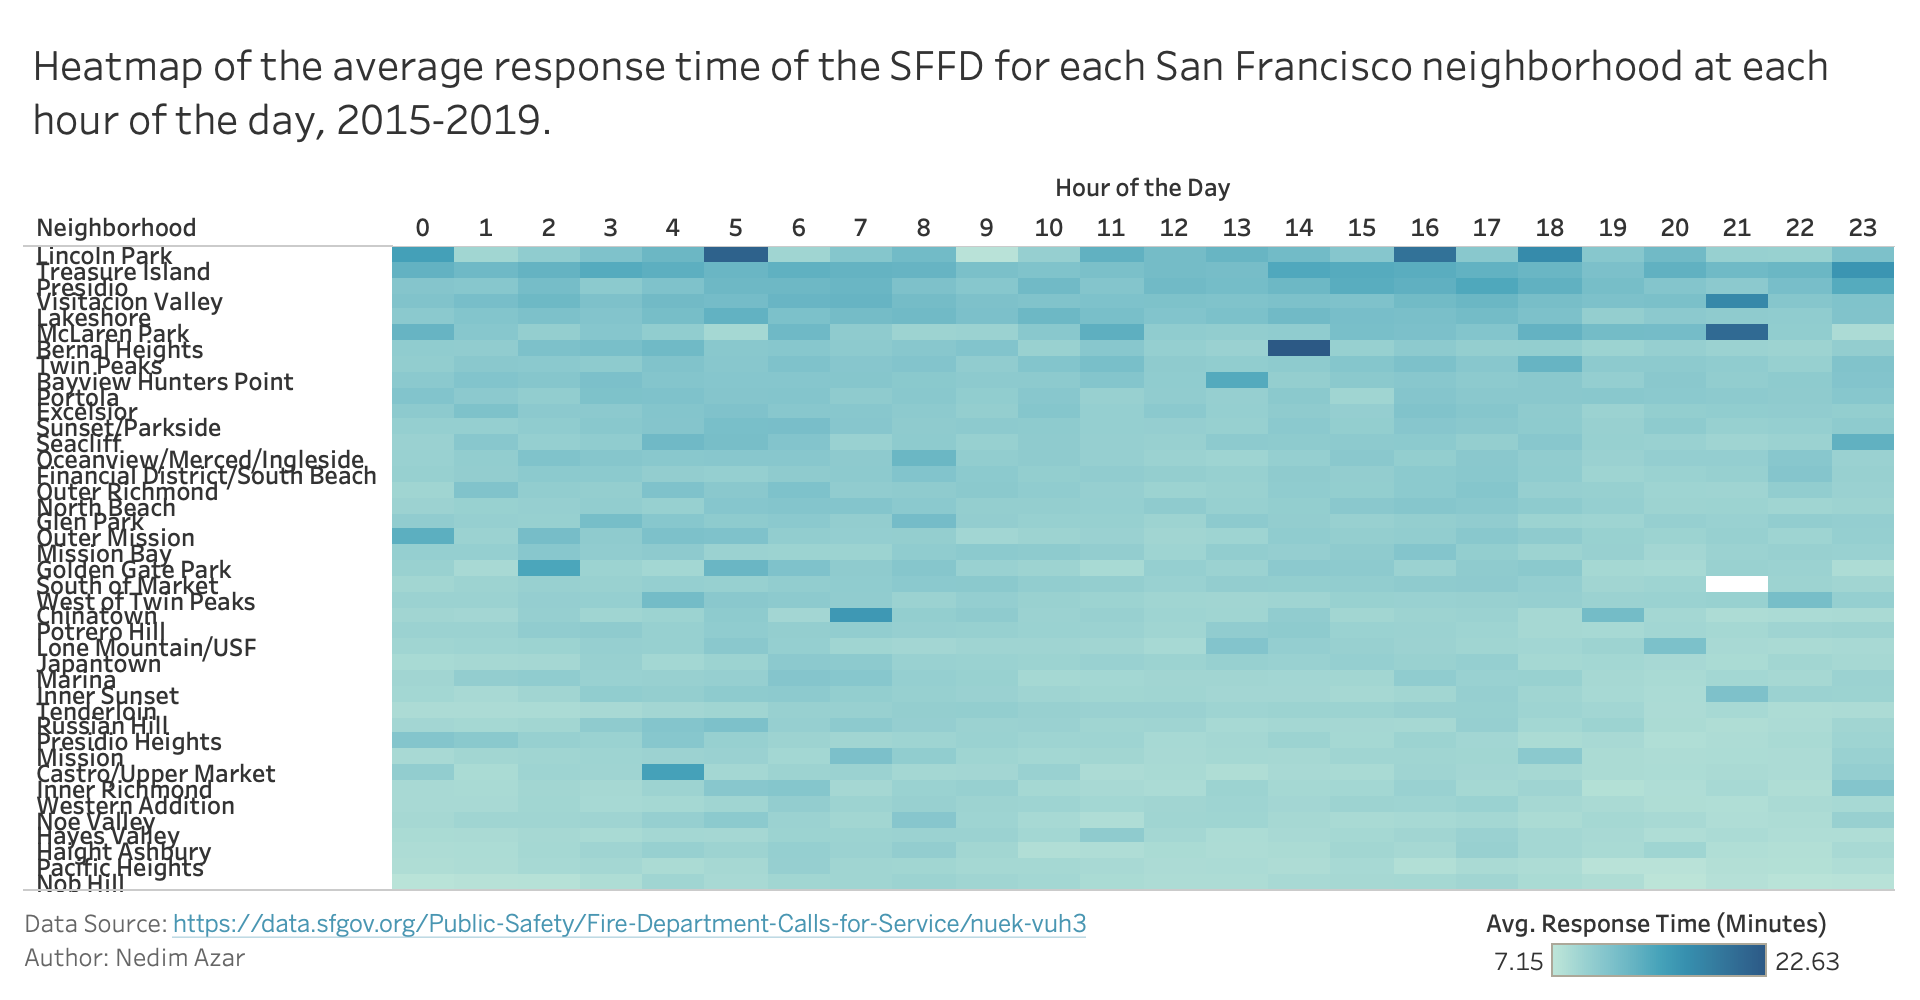
Data source: Data SF, Author: Nedim Azar
The Bigger Picture
This visualization supports the group theme by showing the variance in average response times throughout the day in the 5 year period.