Average Response Time per Neighbourhood in Minutes under Busiest Station 36 for SF Fire Department - HeatMap
Zhenzhen Wang
Wrangling specific to prototype
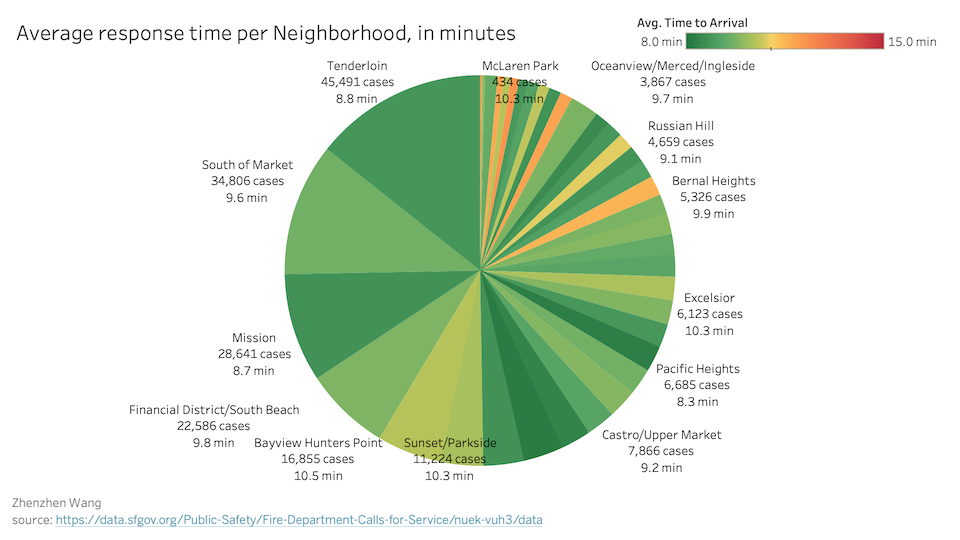
Pie Chart:
Filtered By: Year 2019, Neighborhood not null and Call Type Group not null
Grouping By: Neighborhood, Call type (implementation only)
Aggregated By: Response time (Avg)
Incident Number (Sum)
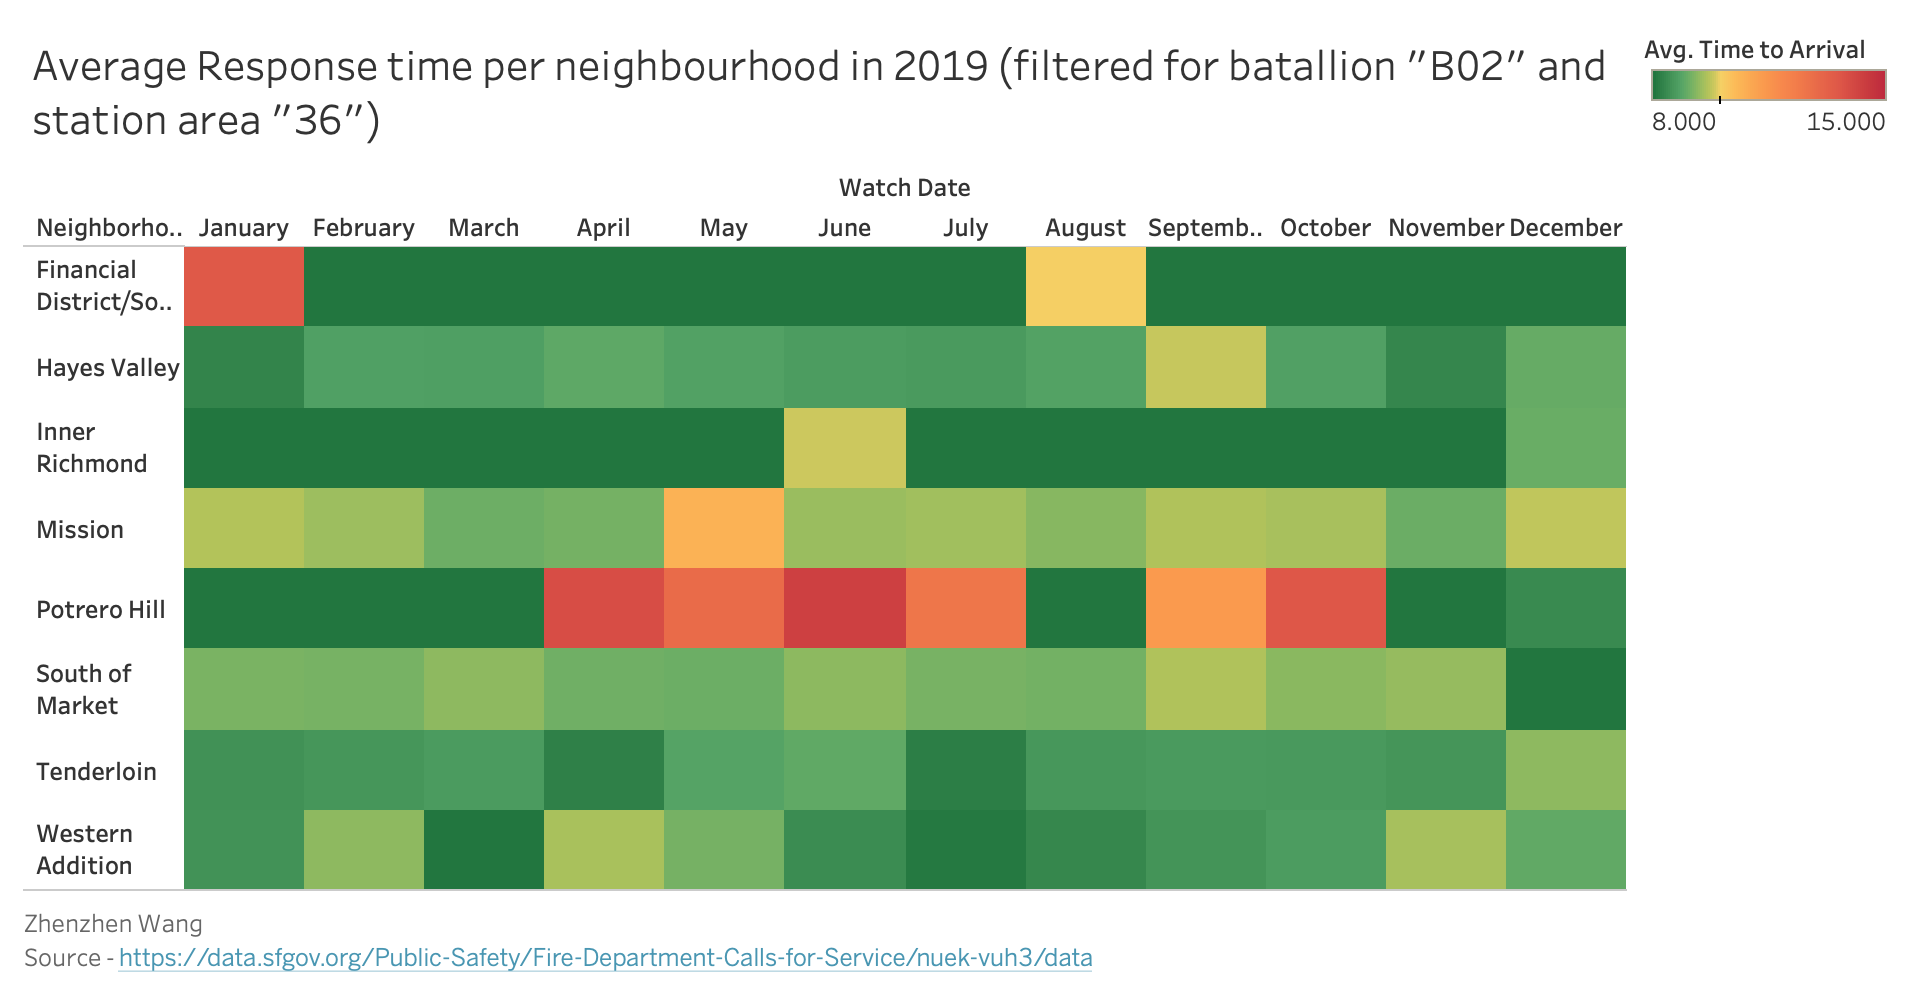
Heatmap:
Filtered By: Year 2019, Neighbourhood not null, Call Type Group not null,
Batallion is "B02", and Station is "36"
Grouping By: Neighbourhood, and Watch Date
Aggregated By: Response time (Avg)
Incident Number (Sum)
Tableau Prototype
Conclusion based on the prototype
The pie chart prototype shows number of incidents in different neighborhoods of San Fcxrancisco, and the response time from fire stations for citizens having different emergency calls. From the prototype above, we can see that the Tenderloin, South of Market and Mission are the neighborhoods having the most number of incidents with all having the good response time (below 10 minutes). It also shows that the fire station response time for the average case is around 10 minutes. The neighbourhood with most number of incidents is Tendelorian (45,491 cases) with an average response time of 8.8 min.
The heatmap prototype shows average response time per month of Station "36" for each Neighbourhood which lies under batallion "B02". From the prototype above, we can say that; the response time for the Financial District in the month of January is above the average response time. This is also the case for Potrero Hill for the month of April, May, June, July, September and October. The neighbourhood of Inner Richmond, South of Market, Hayes Valley, Tenderloin, and Western Addition all have response time below the average response time.
Feedback From Peer Review
| Ratings | Score |
|---|---|
| Rate the non-color encodings on a scale of 5 (appropriate for data type, strong visual channels) to 1 (inappropriate for data type, weak visual channels). | 4.3 |
| Rate the lie factor (including misleading context, weak visual encodings, or exaggerated encodings) on a scale of 5 (low lie factor) to 1 (high lie factor). | 4.3 |
| comments |
|---|
| The color scheme should not be diverging because the data it is encoding does not have negative values. I like how the heat map shows some months where the response time is worse than most others and makes that discrepancy clear. It is also hard to tell which label in the pie chart refers to which slice of the pie. |
| The number of incidents also can be reliant on population for the neighborhood that the battalion serves, so maybe a ratio would be better for lie factor rather than raw count. The labeling for the pie chart is a bit difficult to parse for some of the smaller slices, if that is changed during interactivity to show details as the user hovers over a slice it would help with interpretation. Otherwise, the two charts seem good together, and the interactivity seems like it will provide good information. |
| Changes I made |
|---|
| The scores I got from feedback are pretty good except color encoding. After reading Feedback comments from Classmates, I think it is unnessary for me to have pie char. But Classmates like my heapmap a lot. Because it does not just look nice but also connect with my another two parters' analysing. I changed the color of the heatmap. |
New Tableau Prototype After Feedback
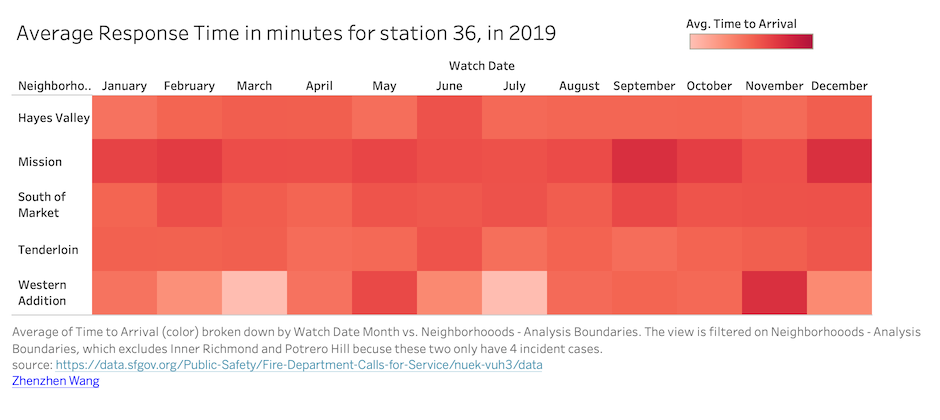
Data encoding
Average of Time to Arrival is broken down by Watch Date Month vs. Neighborhoods - Analysis Boundaries. Color shows average of Time to Arrival. The marks are labeled by average of Time to Arrival. The data is filtered on Call Type Group, Exclusions (On Scene DtTm,Received DtTm), Station Area and Watch Date Year. The Call Type Group filter keeps Alarm, Fire, Non Life-threatening and Potentially Life-Threatening. The Exclusions (On Scene DtTm,Received DtTm) filter keeps 300,288 members. The Station Area filter keeps 36. The Watch Date Year filter keeps 2019.
Only neighborhoods that had at least one incident every month from station 36 are included.
How to Interact with This Visualization?
Mouse over the heat map or bar chart to see details for a particular cell.
Clicking a cell in the heat map applies that filter to the bar chart. Click again to reset to all data points.
- Mission row and January column change to the same color.
- The Bar chart's title will change to Average Response Time in Mission in January 2019, which is corresponding to the cell you clicked.
- The Bar chart's 4 columns will change to the different heights deponding on Mission and January
Clicking a bar in the bar chart applies that filter to the heat map. Click again to reset to all data points.
- The Heatmap's title will change to Average Response Time for Non Life-threatening calls in 2019
- The heatmap will only show the average response time for Non Life-threatening
D3 Implementation
Findings Learned from This Visualization
- Tenderloin, the neighborhood with the most number of incidents, has an average response time of 8.5 minutes.
- Non-life threatening calls take longer to respond to than other types of calls, which makes sense because they have lower priority.
- For this station, calls from the Mission neighborhood take the longest to respond to on average, and this is consistent across all months of the year. Perhaps the department should investigate ways to improve the response time here.
How this visualization supports the theme?
Visualizations helps in analysing the number of incidents in different neighbourhoods of San Francisco, and we can see here for a particular station (36) both the caseload and response times per neighborhood.
Inspirations